AREA OF APPLICATION

Dashboards with interactive charts

Dashboards make it easier to follow up on key figures, see status and detect deviations in time. The information is presented visually in charts that provide a quick overview and good support for decisions, without the need to search in reports or export data to external tools. Everything can now be gathered in one place in AM System Classic.

diagram-cross

AM System describes

Create living dashboards with Charts

Charts in AM Classic visualizes data from cases and documents in interactive charts that update automatically in real time. The function provides a clear and easily accessible situation picture of the business's results and trends.

It creates a better basis for decision-making based on current data and enables more proactive management - without external tools or recurring manual work.

Discover Charts

Visualize

Make complex information easy to understand

Make data in AM System Classic easy to understand, follow up and act on. With Diagrams, you can transform information from cases and documents into clear visual overviews that show current status, development and patterns. This makes it easier for both management and the business to see what is happening - without getting stuck in manual lists or reports.

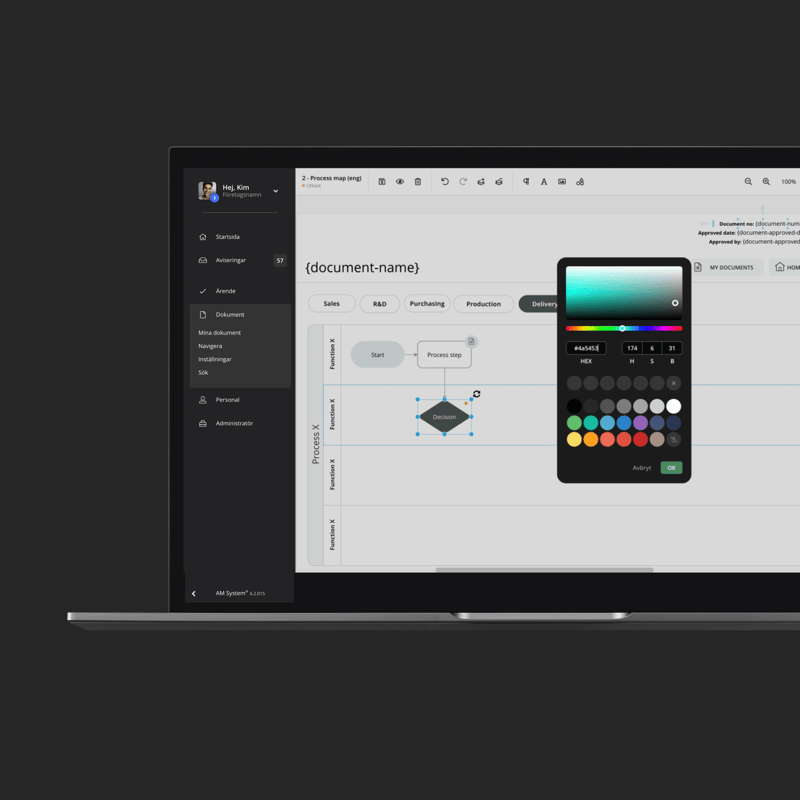
  • Easily create charts directly in layout documents.
  • The result is a better overview of key areas of the business.
  • Make data more accessible to more roles and levels in the organization.

Follow up

Follow the progress of your business in real time

Get a more vivid and fact-based follow-up of your business's most important processes in customized dashboards. This provides better support for meetings, priorities and management decisions.

  • Follow developments without manual summaries.
  • Get a comprehensive view of your business KPIs in customized dashboards
  • Strengthen the follow-up of objectives, requirements, deviations and improvements.


Focus

Highlight what's important

Highlight what is most important for each role, process or area of activity. Dashboards with Charts can create relevant views for management, quality, environment, production or purchasing, for example. This allows the right function to find the right information faster and spend time on the right actions.

  • Collect and focus on relevant KPIs per function.
  • Identify areas that require action or extra focus.
  • Share the same situational awareness for better understanding and engagement


Agera

Move from insight to action faster.

Move from insight to action faster. When information is presented visually and live, it becomes easier to spot patterns, prioritize actions and follow the impact of implemented measures. The charting feature makes the management system a more active tool for governance, improvement and control.

  • Customize dashboards for different roles, needs and ongoing actions.
  • Prioritize actions based on current outcomes and trends
  • Create better conditions for continuous improvement.

Customer case

What our customers think about charts

“With charts in AM System, we can visualize our workflows, monitor performance in real time, and make faster, data-driven decisions. We use it for everything from incidents and accidents to quality deviations and continuous improvement initiatives. We are now exploring how dashboards can support both our long-term goals and the daily management of the factory.”

Tommy Säll Quality Manager - Pipelife Sweden

“The chart functionality gives us a quick and clear overview of our KPIs by visualizing trends, targets, and deviations in a visual format. It makes it easier to understand the current situation and make well-informed decisions.”

Eva Blomgren QEHS Coordinator - Kuusakoski Recycling

“With dashboards and live visualizations, our QMS has evolved from static reports into an active decision-support tool. It has made it significantly easier to identify deviations, follow trends, and prioritize the right improvement actions.”

Simon Assgård Quality Manager - HydraSpecma

“What gets visualized gets understood — and what gets understood can be improved.”

Eva Blomgren QEHS Coordinator - Kuusakoski Recycling

Support for long-term development

With a clear and up-to-date situation picture, the entire organization can get an overview of results, trends, risks and deviations in areas such as quality, safety, production, supplier and document management. The information is easy to absorb, easy to follow over time and possible to delve into when needed. The result is better decision-making, clearer priorities and more proactive management throughout the organization.

SIMPLICITY & EFFICIENCY

Simple in layout documents & effective with templates

Charts are built directly in layout documents, where you can combine charts with text, links and other important information and navigation. This makes it easy to create clear and intuitive dashboards for, for example, management, processes, departments or meetings for daily management. With your own templates or templates from AM Systems' library, you can reuse structure and pedagogy, so that the follow-up is both uniform and effective.

Templates and examples of processes and flowcharts

Get a demo

Ready to make work easier - and more enjoyable?

Want to see for yourself how AM System can make a difference for you? Book a demo and discover how easy it is to create structure, efficiency, and seamless workflows in your daily operations.

Testa-AM-System-gratis-1