

- 693
Active charts
- 77
Dashboard pages
- 7
Global dashboards
- 300
Unique users use dashboards daily
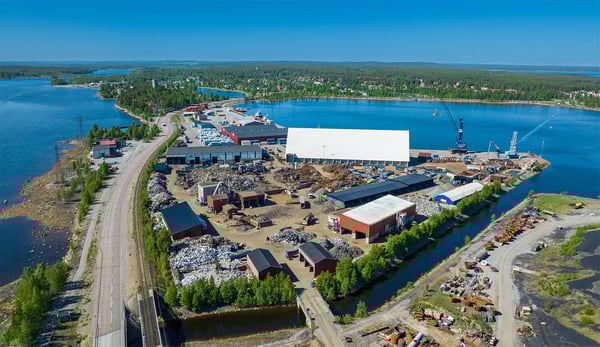
HydraSpecma works with hydraulic systems and components for some of industry's most demanding environments. Complaints, incidents and deliveries need to be followed up quickly and clearly. Previously, much reporting was done in Excel and external tools. Today, the information is visualized directly in AM System through dashboards that provide a quick overview for both office and production.
- People like to take shortcuts whenever they can. If you structure everything in a system, there’s only one way to do it. Then it’s done the same way every time, says Simon Assgård, Quality Manager.
At HydraSpecma, which develops and manufactures hydraulic systems and components for industry, large amounts of information are handled every day. Complaints, incidents, deliveries and quality issues need to be followed up quickly and in the same way regardless of site or person.


Simon has worked with AM System since 2006. First as a quality technician and later as quality manager. Over the years, more and more processes have been moved from Excel files and email threads into the system. With long experience behind him, he knows that it is important to keep the system simple and manageable.
- I try to build workflows as small as possible. What you see on the screen should be important to fill in. There should be no noise.
But it's not just about structure, it's also about the user experience.
- It has to look good. It has to be fun to go in and work in the flow. The more user-friendly it is, the more people will use it.
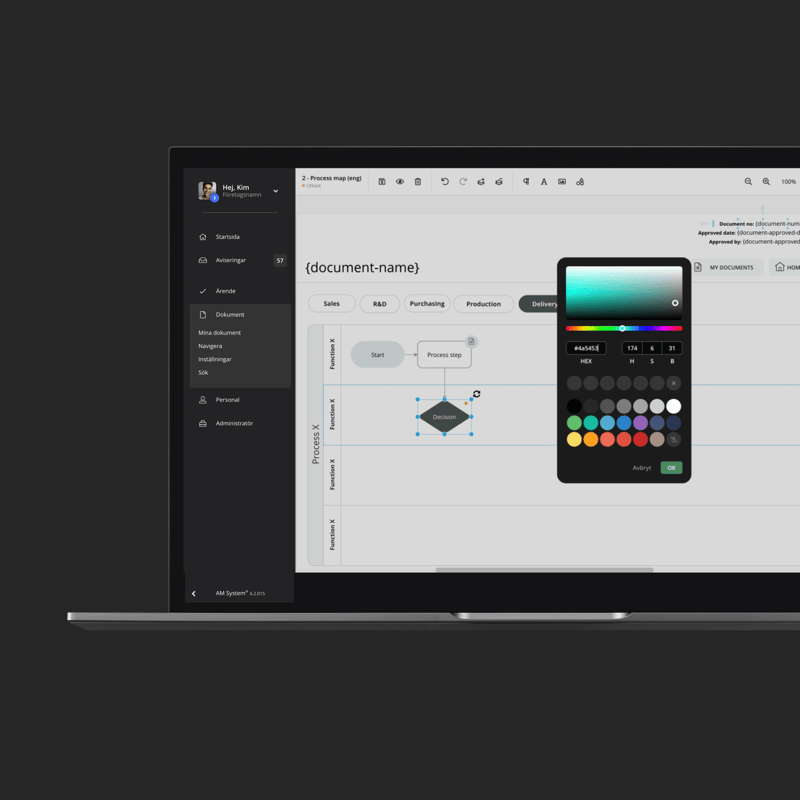
Dashboards that make quality data easier to understand
When dashboards were launched in AM System, he immediately saw the potential. For HydraSpecma, dashboards became a way to bring the collected data to life.
- That feature was applauded by us. I tested it right away and saw great areas of use.
Previously, a lot of visualizations were built in external tools like Power BI or Excel. Now the same data can be visualized directly in AM System.
Instead of exporting data and building graphs manually, it is now possible to easily click on the overview directly in the system. One example is the complaint management.
- We have a summary page where we can see the entire group or break it down by site. You can immediately see how many complaints there are and can click on a bar to get to the cases behind.

This makes it faster to find the right information and easier to act immediately. They have also built dashboards for suppliers, incidents and incoming items.
- Previously, new articles were stored in large Excel lists and email threads. Now we can see which items are coming in, when they should arrive and if something is delayed. It becomes much clearer.
Visualization that simplifies quality management
One of the biggest impacts is not just about time. It's about understanding.
- Once people saw the diagrams and realized how quickly they could get information, they started coming up with ideas for more workflows we should move into the AM System.
Instead of searching the system or building their own summaries, supervisors and employees can get a quick overview directly.
- For example, regarding incidents and accidents. Now they can click a button instead of manually searching for the information.


Making AM System easier to use throughout the organization
Today, dashboards are mainly used in office environments. The next step is to bring the ways of working even closer to production.
The plan is to have tablets at all sites, where employees will be able to easily log in and manage their cases, improvement suggestions and incidents directly.
- Many people working in production want to understand why things are getting better. You have to have a clear purpose for the change.
At the same time, Simon does not see change as something dramatic.
- If you implement a new way of working and it doesn't work, you can always go back. It doesn't have to be so big and complicated.
No more exporting to other systems
For Simon, dashboards are about making data understandable.
- With AM System, you build forms that collect data in exactly the same way from everyone. With dashboards, you can then visualize the data directly instead of exporting everything to Excel and building graphs there. If something needs to be changed, it's easy to tweak the report instead of starting from scratch," Simon concludes.
Short questions with Simon Assgård
Number of dashboards built?
- 7 global dashboards with 77 dashboard pages. These consist of approx. 693 charts right now.
How many people use them today?
- About 300 unique users in recent weeks
How often are they used?
- All dashboards are used daily, both at individual level but also in group meetings on a daily basis, applies to the entire group
How long did the first dashboard take to build?
- The first edition probably took 30 minutes but since then it has been filed up to 3 hours I would guess. It is a continuous development of them as we can quickly go in, tweak and then publish within minutes. One of the biggest selling points of the system I would say in general.
How many cases are registered each month?
- About 550 cases a month, which gives around 22 cases a day. However, this is only on the 5 largest forms we use, in total we have about 35 forms

The facts
HydraSpecma's areas of use for dashboards today:
- Complaints
- Supplier overviews
- Incidents and accidents
- Incoming items and deliveries
Next steps:
-
Tablets in production
-
Separate logins for production staff
-
More flows directly in AM System
READ MORE
Related case studies

OptiPack uses AM System for its systematic work environment management

How NOTE ensures efficiency and ISO compliance with AM System

Efficient workflows and increased quality at Hultdins

How Fogmaker uses AM System to meet its own requirements
Log Max harvests success worldwide – chose AM System for their entire quality management system.
Request a demo
Ready to make work easier and more enjoyable?
Want to see firsthand how AM System can make a difference for you? Request a demo and discover just how easy it is to create structure, efficiency, and seamless workflows in your daily operations.