Article
-
 Editorial team
-
- Process Mapping
- 3 min reading

Flowcharting - Understanding, improving and visualizing processes
A flowchart is a visual tool used to describe and analyze a process flow in logical steps. By combining symbols and text, it shows what a process looks like - from start to finish. It is used in a wide variety of fields to provide structure, clarity and overview. Whether it's a business process, an IT system or a production flow, the flowchart is a powerful support for decision-making, quality assurance and efficiency.
In what contexts is it used?
A flowchart can be used for several different purposes and contexts:
- Documenting a process
- Streamline business processes
- Identifying and preventing bottlenecks
- Understand the big picture and how the business fits together
- Standardize processes, for example according to ISO 9001 or ISO 14001
- Organize tasks and assign responsibilities
- Communicate a complex process or idea
- Motivate and make decisions
Benefits of a flowchart
Working with flowcharts creates structure and overview in both small and large processes. By visualizing steps, roles and responsibilities, it's easier to understand the big picture, identify areas for improvement and ensure everyone is working towards the same goal.
Visual clarity
Visualizing a process or idea using a flowchart makes complex events easier to understand. It becomes clear what is happening, in what order and who is responsible.
Better communication
The diagram acts as a common language between different functions and roles. It reduces the risk of misunderstandings and facilitates collaboration.
Meeting quality requirements
Documenting processes in flowcharts is an effective way to secure knowledge within the organization. It makes it easier to follow up on procedures and meet quality requirements.
Document management
When a document management system is combined with clear flowcharts, a robust structure for controlling and monitoring document flows is created. The diagram shows exactly how a document should be created, reviewed, approved and archived.
Problem solving
When a problem arises, a schema can help identify where in the process it went wrong. With a case management system in place, it becomes easy to follow up and fix problems.
Flowchart example
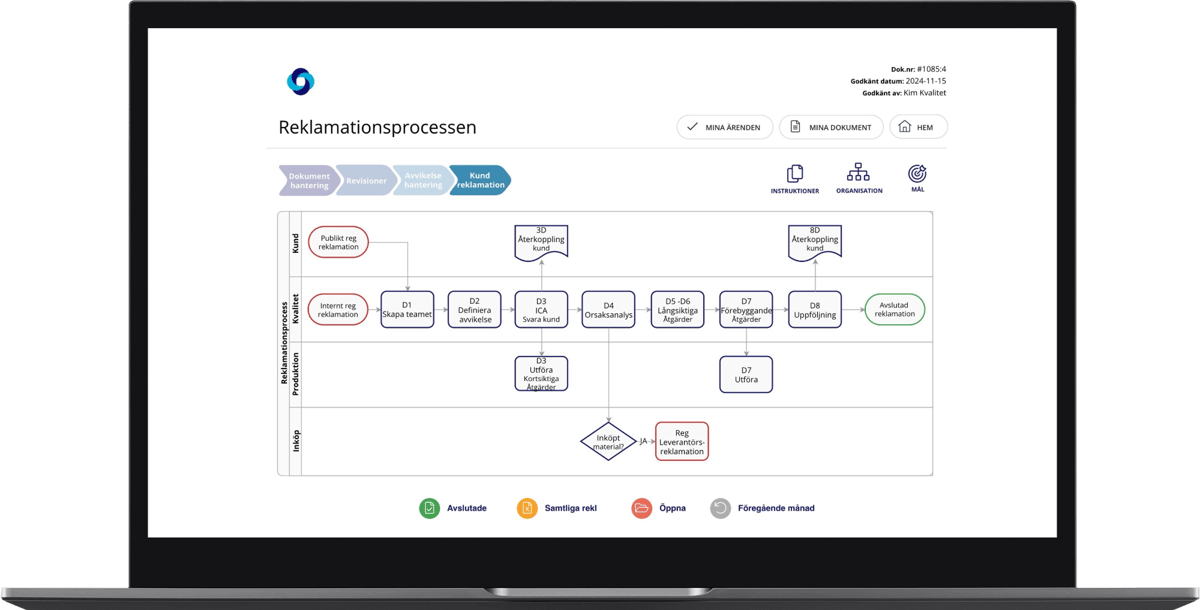
A process flowchart showing how different departments interact in a workflow.
Different types of flowcharts
Depending on the purpose it serves, diagrams can look different:
Process map
A process map shows the steps involved in a business or operational process. It provides clear structure and is used to analyse, improve and standardize workflows, for example in an internal process mapping exercise.
For decisions
Used to visualize choices and consequences. It helps the user to make the right decision based on different scenarios and conditions. Often yes/no questions or conditions are used that lead to different outcomes.
Logical flowchart
Shows the logical order of a process or program and is commonly used in programming and system development, where it is important to understand how different conditions, loops and functions relate to each other.
For systems
Used to show how data flows through a system - for example an IT system or business system. It provides an overview of the input, processing and output in different parts of the system.
For product
Focuses on flows within production, from raw material to finished product. It is often used in manufacturing industries to optimize logistics, machine utilization and quality assurance.
For documents
Describes how documents are managed, distributed and approved within an organization. It is particularly useful in quality management systems where document management is of great importance.
Creating a flowchart
Creating a flowchart is about identifying the purpose and steps of the process, and then visualizing these in a structured way.
- Identify purpose - Be clear about why you are making a diagram - is it to improve a process, meet requirements or train staff?
- Sort tasks - List the steps in chronological order to provide a logical flow in the visualization.
- Choose the right symbols - Standardized process mapping symbols are used to represent starts, decisions, processes and documents.
- Process mapping - Make sure you have the whole picture - interview relevant people and collect data about the process.
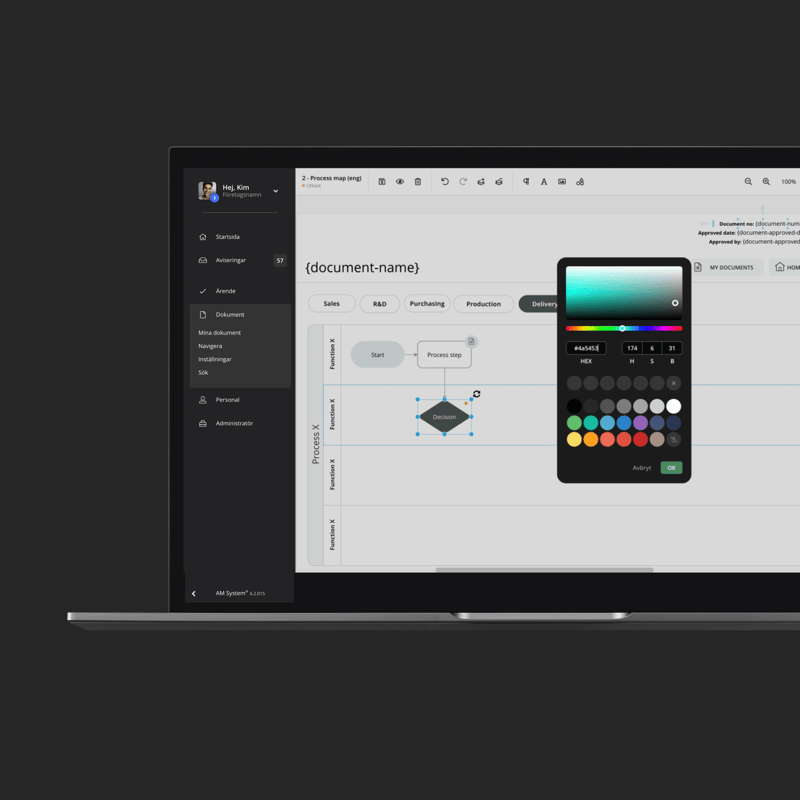
- Draw your diagram - With AM System's management system, you can create flowcharts directly in the system.
AM System helps you
A digital management system from AM System makes it easy to create flowcharts - and link them to your procedures, documents and responsible roles. By digitizing your process flow, you get a living and updated process map that strengthens quality, responsibility and efficiency.
Our platform is built to support companies in all industries that want to improve their internal processes, for example in the food industry. Whether you are working with ISO certification, systematic environmental work or business development - AM System gives you the tools to visualize and improve what really makes a difference.
Get a demo
Ready to make work easier - and more enjoyable?
Want to see for yourself how AM System can make a difference for you? Book a demo and discover how easy it is to create structure, efficiency, and seamless workflows in your daily operations.